Bifunctional long non-coding RNAs prediction
-
1
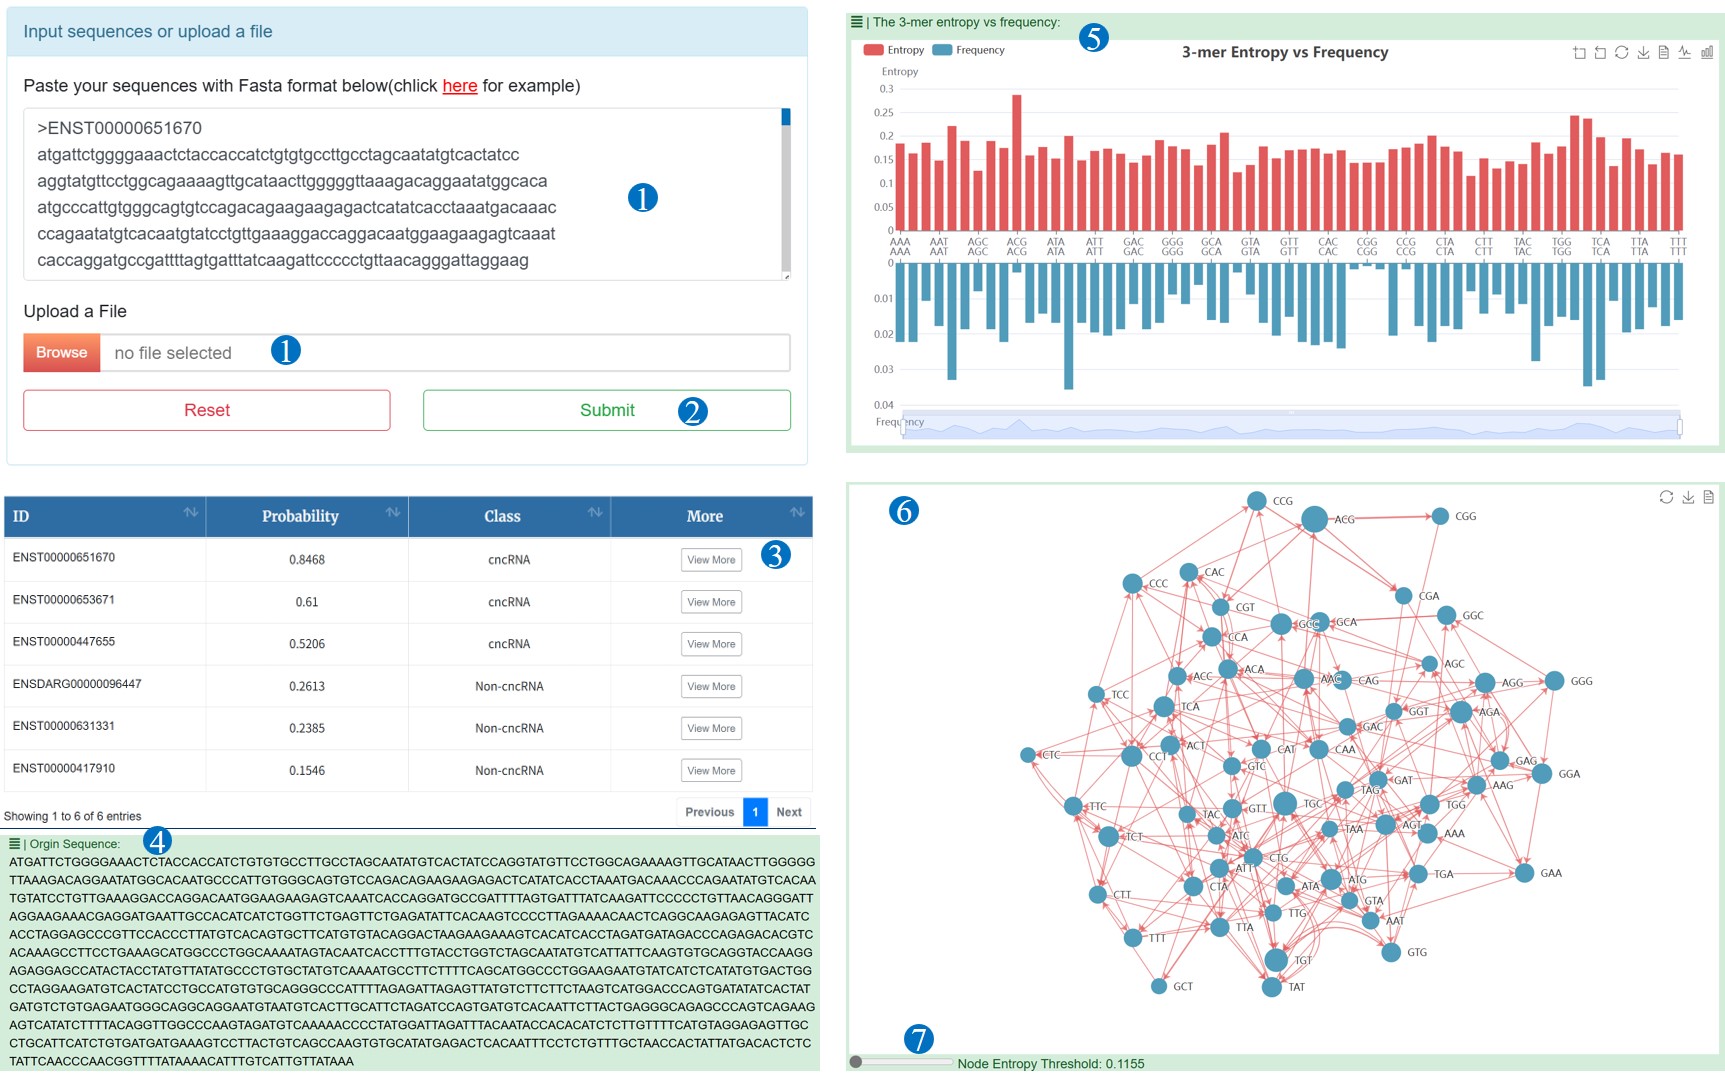
Input sequences: Paste lncRNA sequences in FASTA format into the text area, or click "Upload" to submit a local TXT/FASTA file.
The server automatically checks whether each sequence contains only A/T/C/G nucleotides and recommends a length ≥ 100 bp.
-
2
Submit job: Click "Submit" to start the prediction.
-
3
The results page contains the sequence ID, predicted probability and label, and the corresponding sequence details can be viewed by clicking the More button.
-
4
The original sequence submitted by the user.
-
5
Histogram of entropy and frequency distribution of sequence 3 mer.
-
6
A directed graph composed of sequences 3 mer, with the size of the points indicating the entropy value and the thickness of the edges indicating the value of the attention weights.
-
7
By setting the entropy value, filter the nodes and their corresponding subgraphs that are larger than this value.
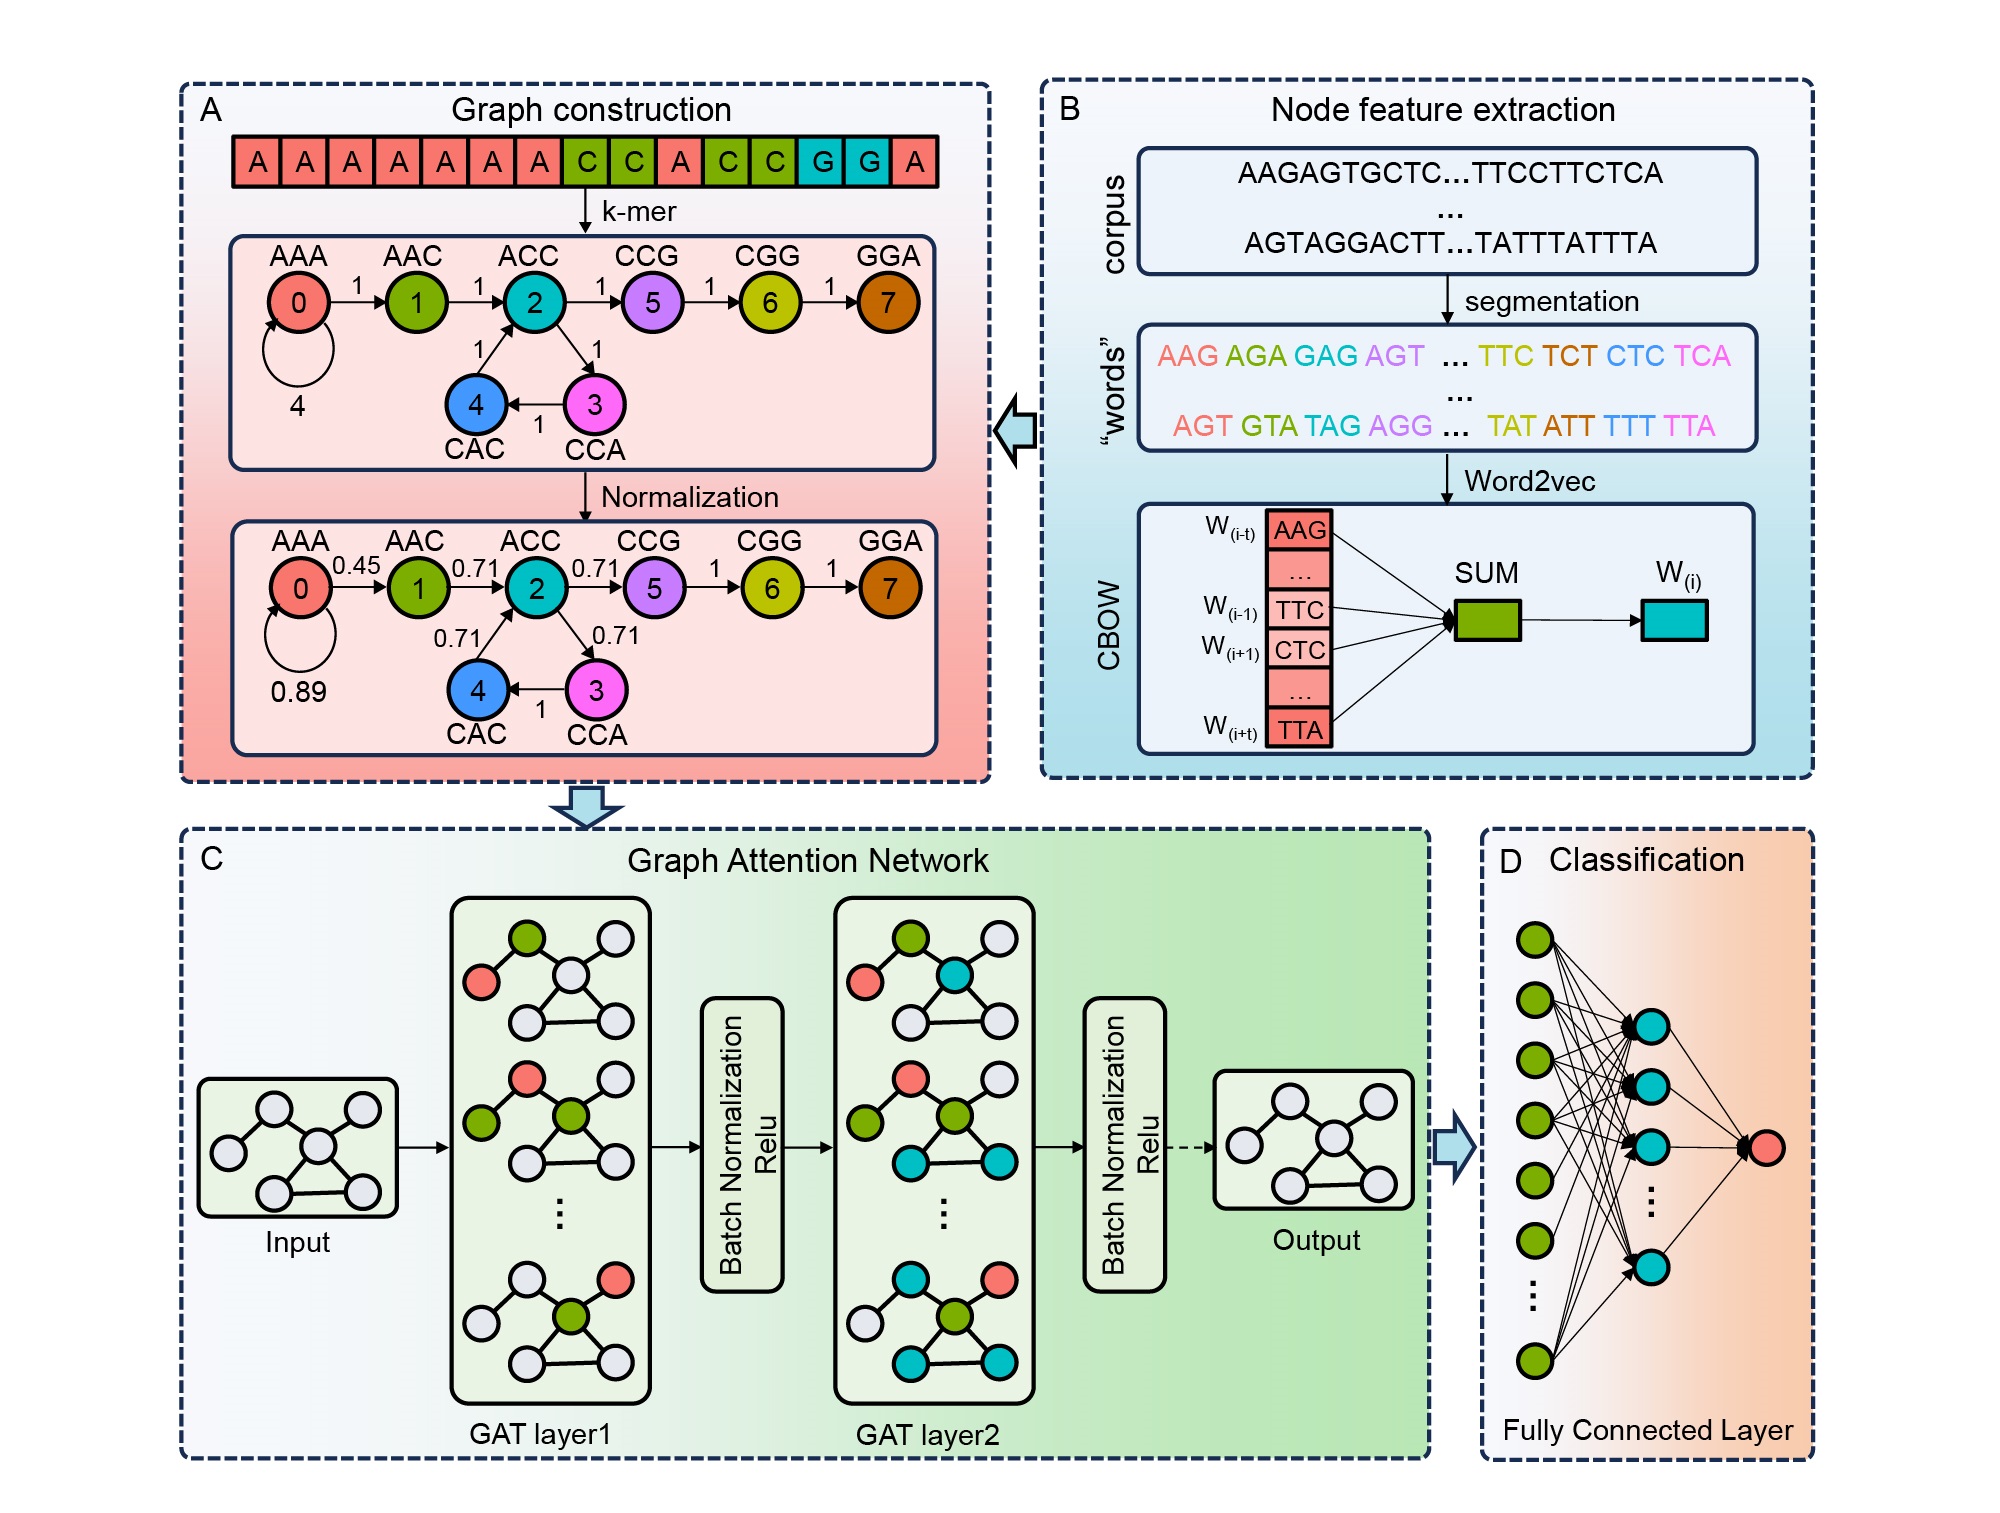
The framework of cncFinder. (A) Graph construction from lncRNA sequences. (B) Node feature extraction using Word2Vec. (C) Feature propagation via GAT layers. (D) Final classification of bifunctional potential via fully connected layers.
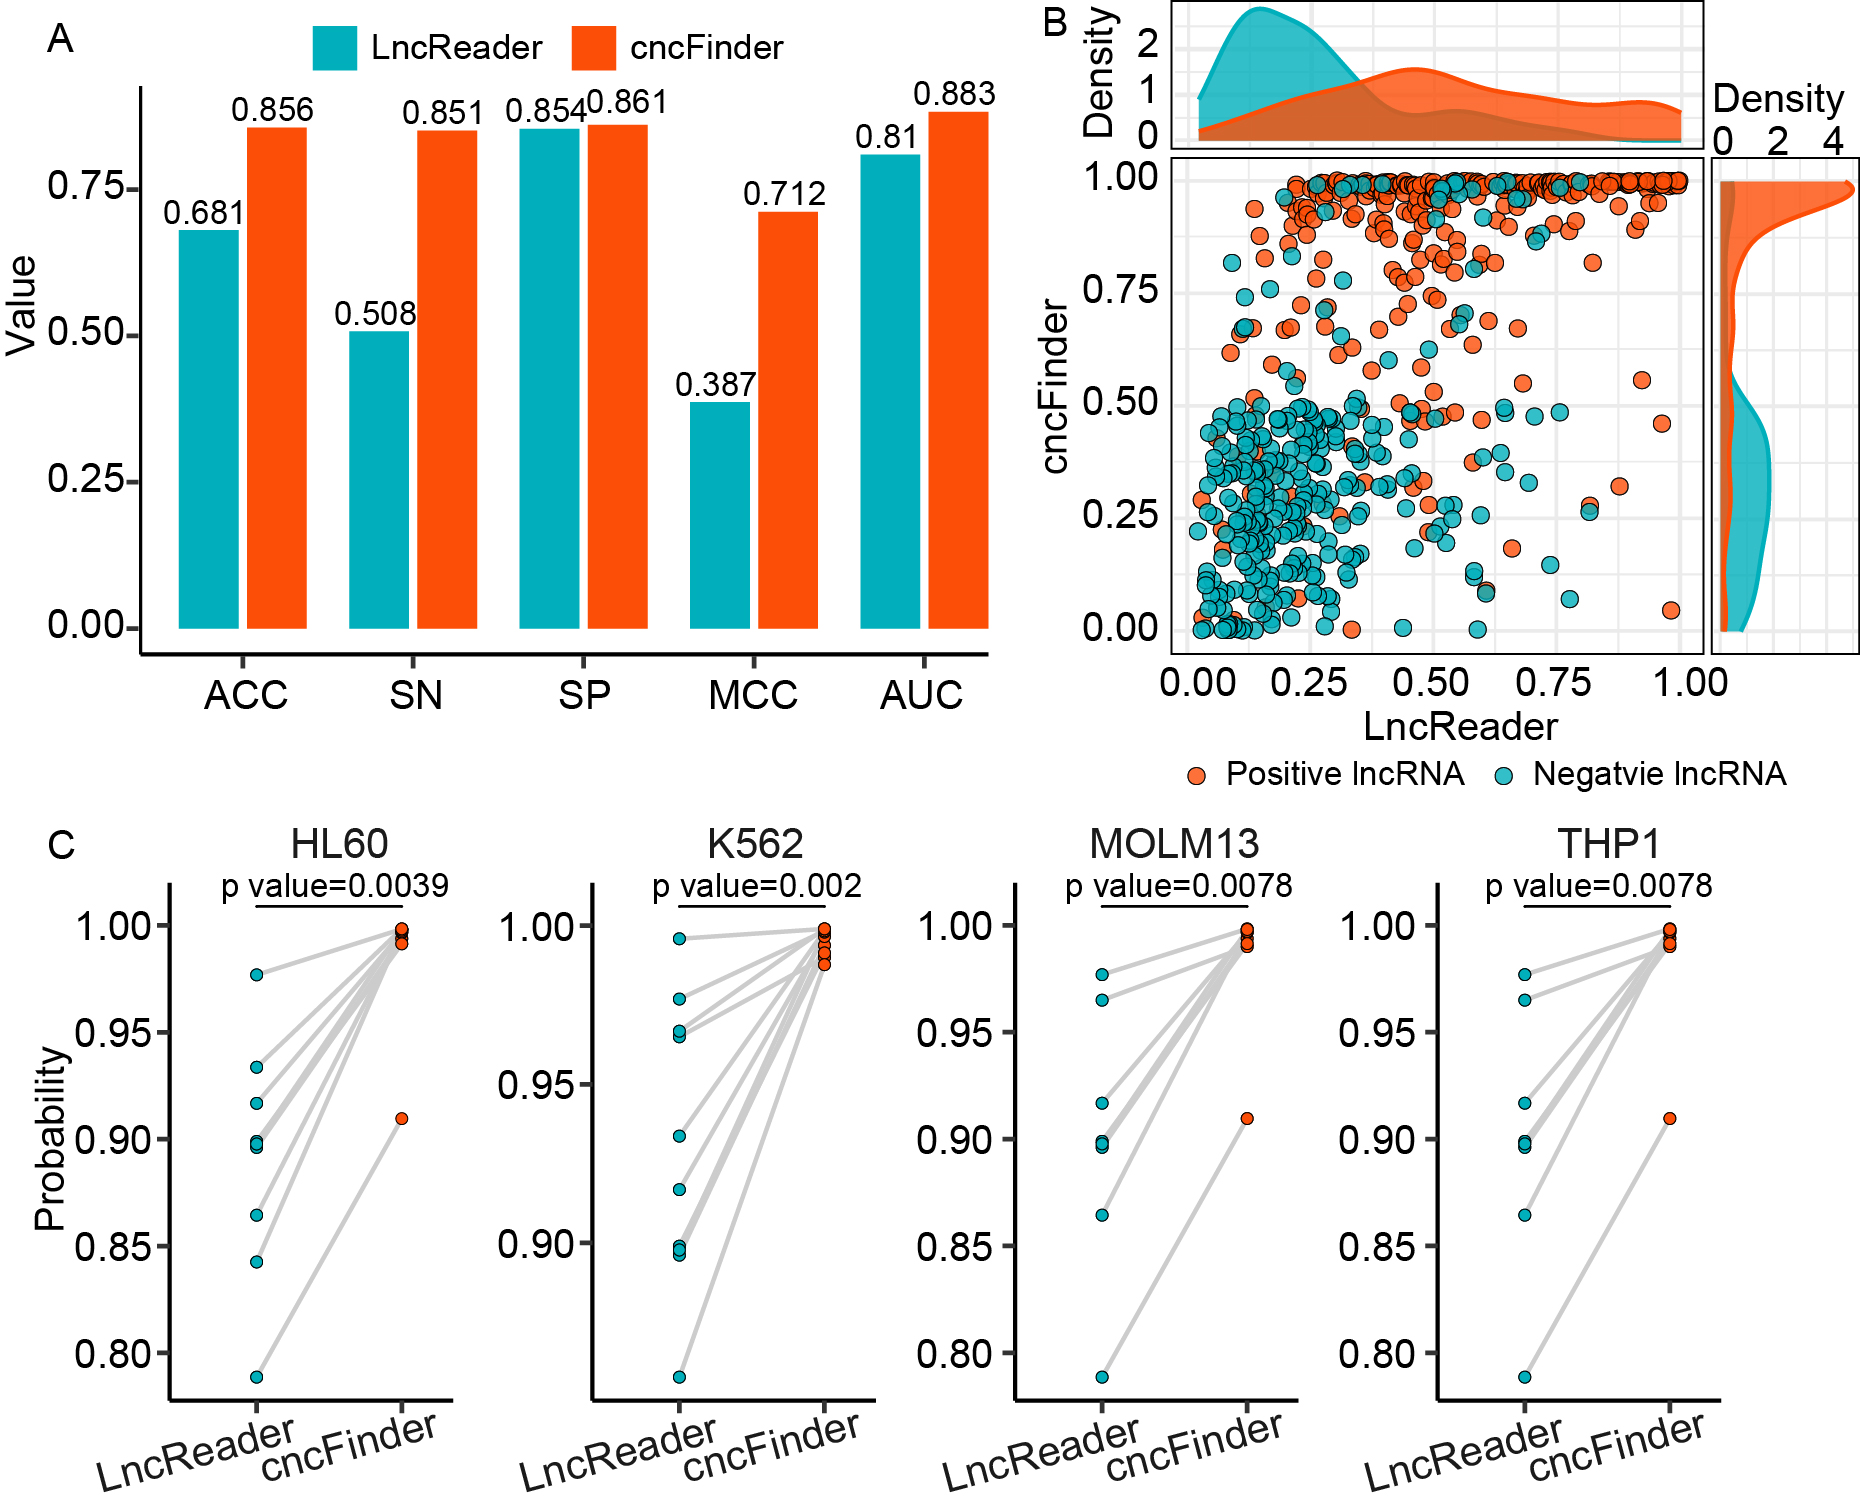
Performance evaluation on the testing dataset. (A) Comparison of evaluation metrics between cncFinder and LncReader. (B) Scatter plot of prediction probabilities assigned by cncFinder and LncReader. (C) Prediction probabilities across four cell lines, statistical significance was assessed using the Wilcoxon rank-sum test.
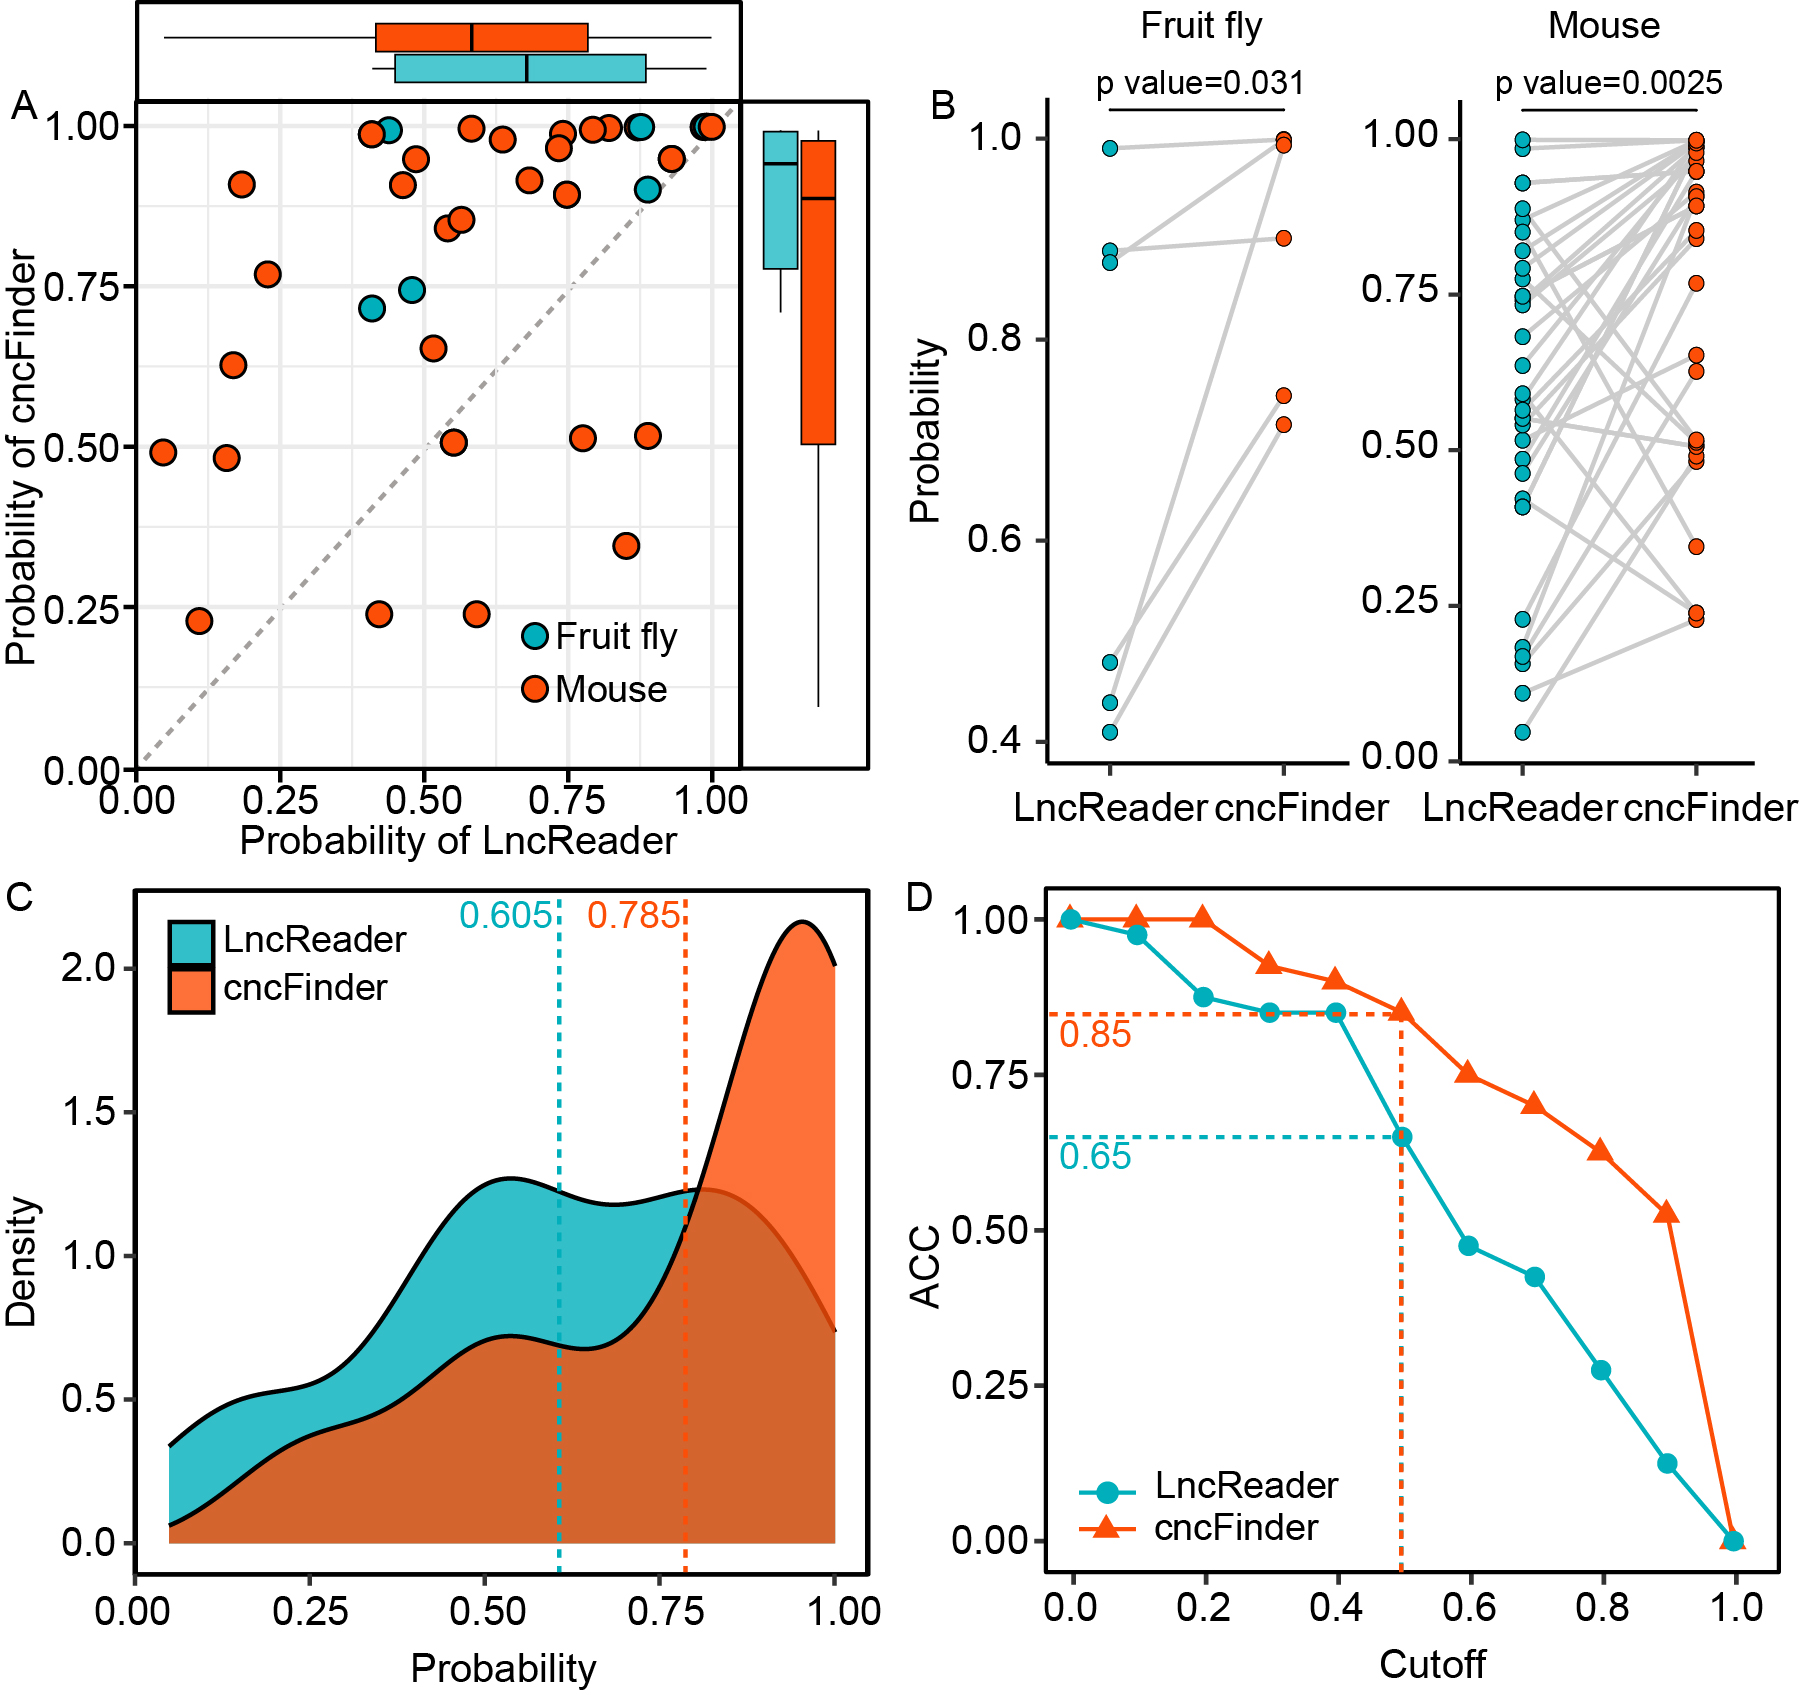
Cross-species prediction performance of cncFinder and LncReader. (A) Scatter plot of prediction probabilities for bifunctional lncRNAs from different species. (B) Comparison of prediction probabilities for different species, statistical significance was assessed using the Wilcoxon rank-sum test. (C) Probability density curve of predicted probabilities. (D) Accuracy comparison across varying classification thresholds.
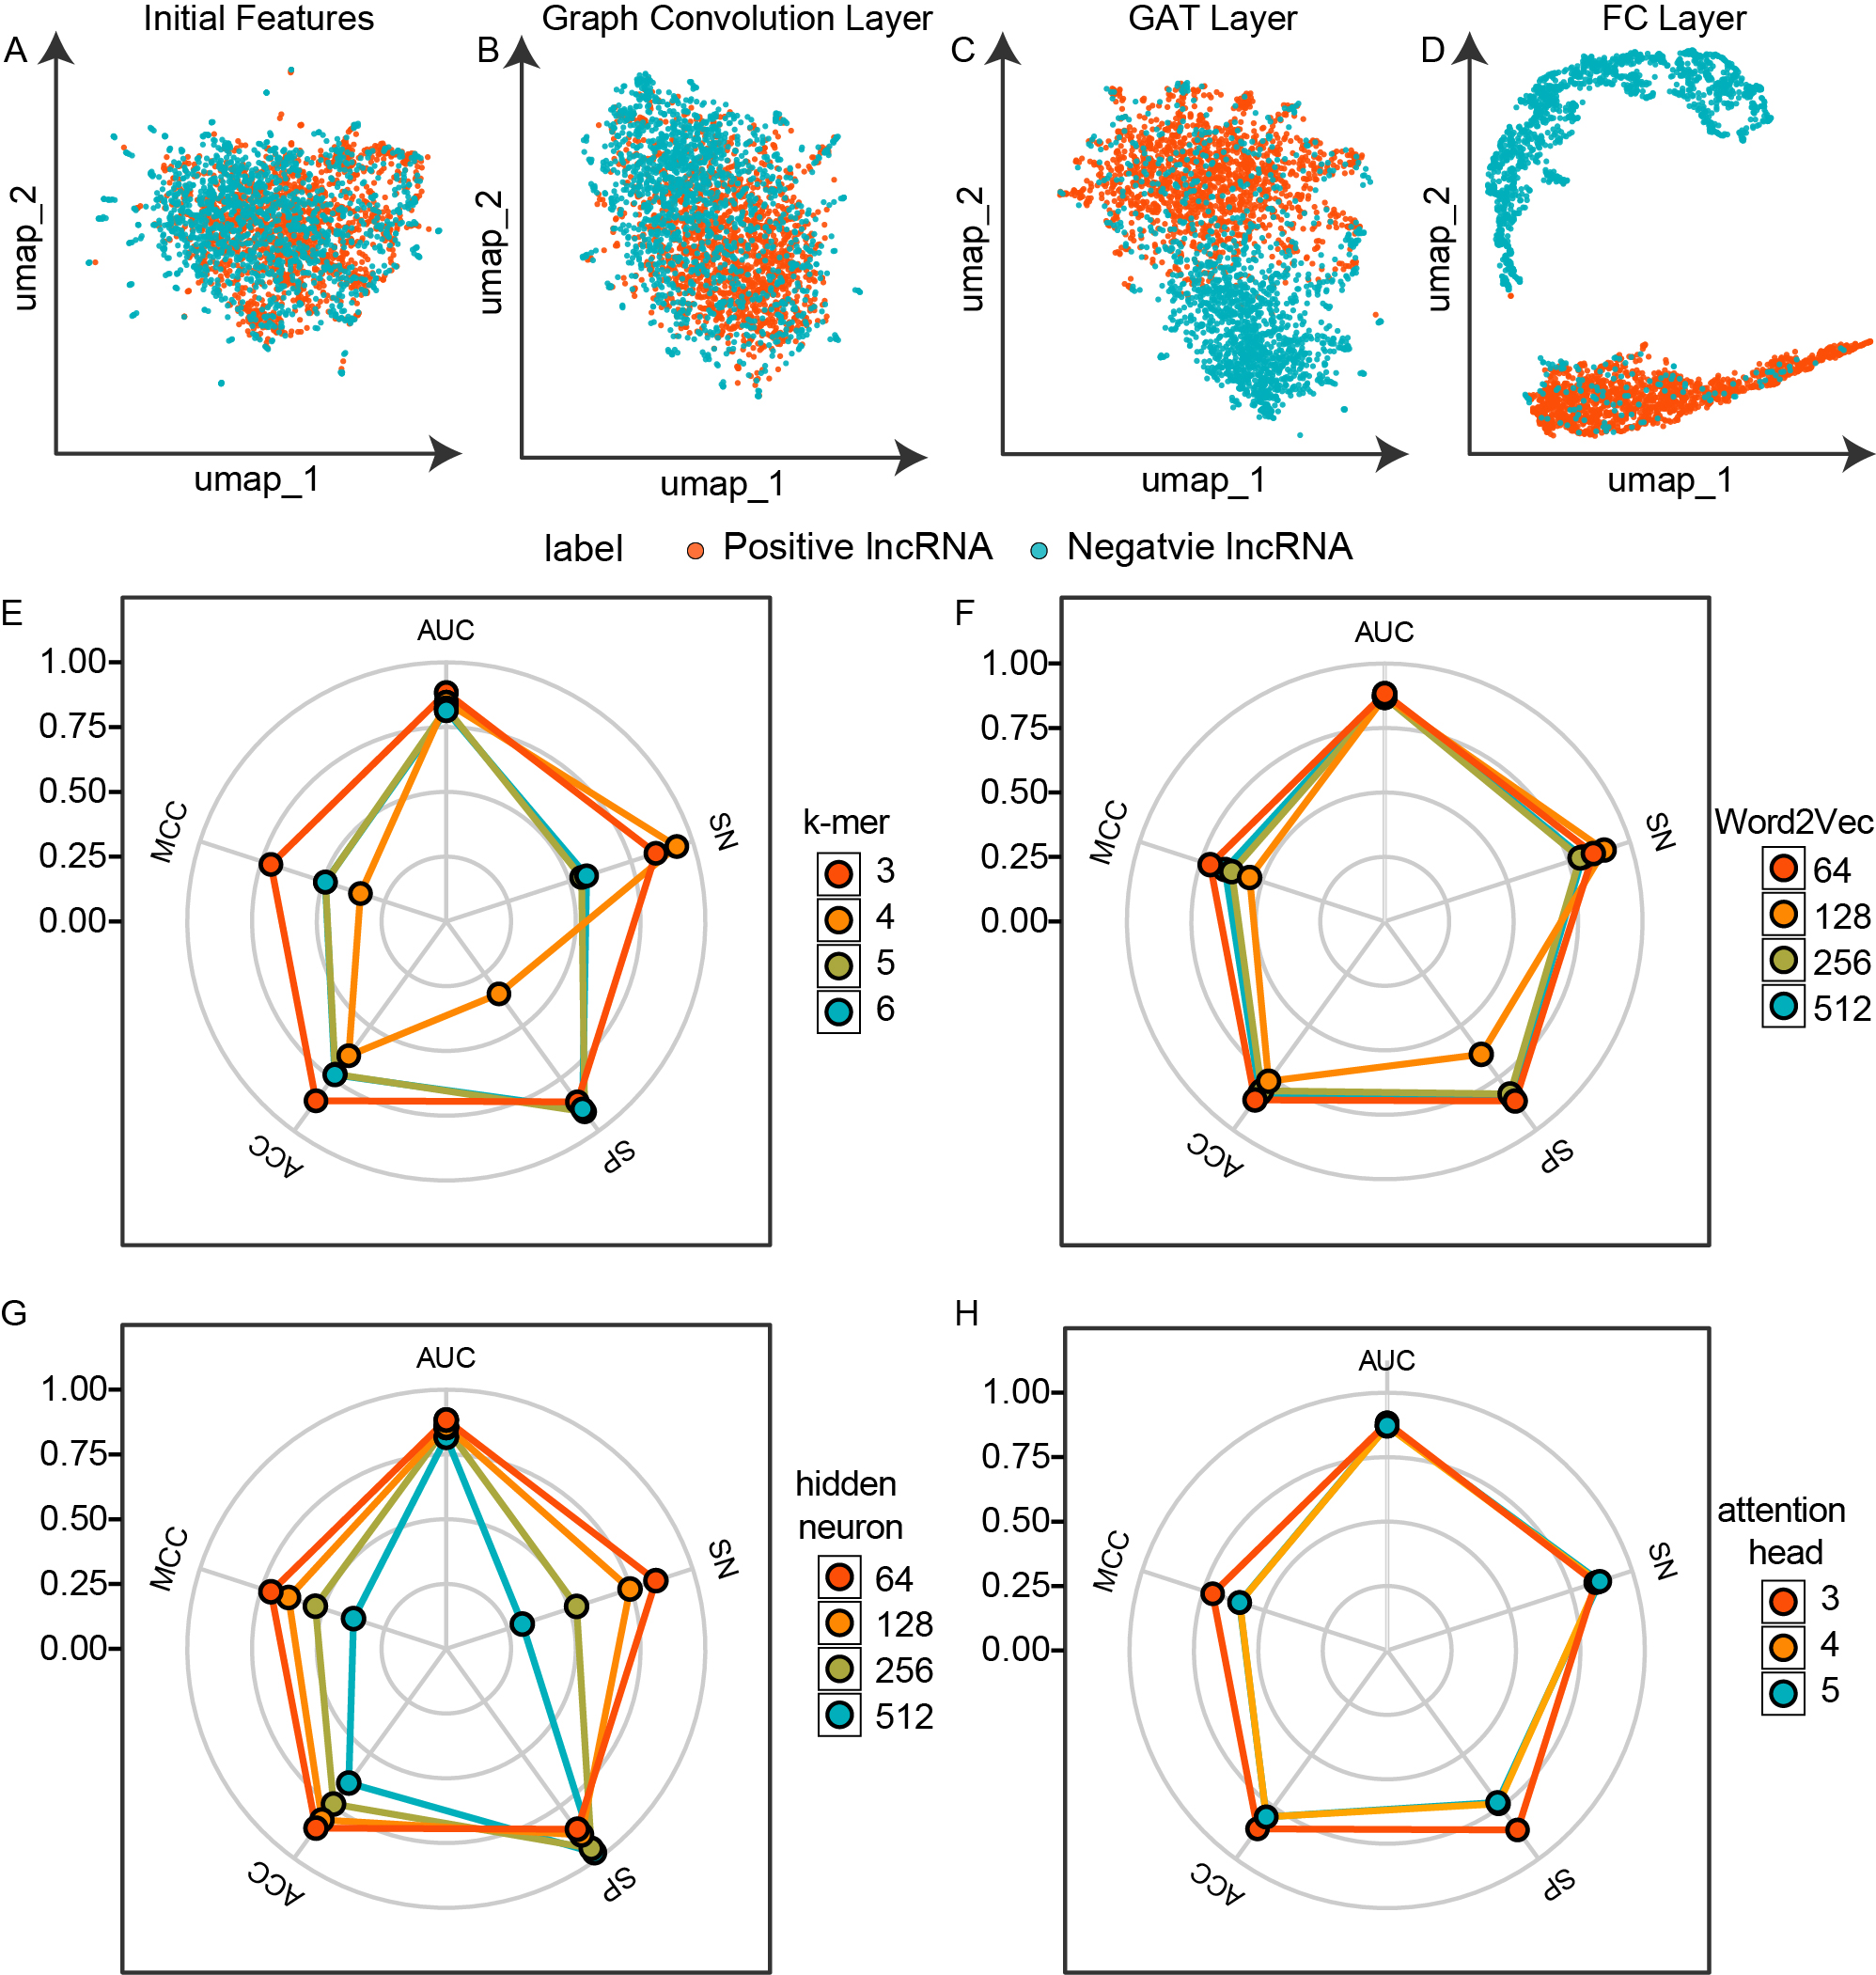
UMAP visualization and hyperparameter perturbation analysis of cncFinder. (A–D) UMAP visualization of features extracted from various layers of cncFinder. (A) Initial features, (B) Graph output features before the GAT layer, (C) Output from the GAT layer, and (D) Output from the FC layer (E–H) Model performance under different hyperparameter settings evaluated on the testing dataset. The evaluated hyperparameters include (E) k-mer size, (F) Word2Vec embedding vector dimension, (G) number of hidden neurons, (H) number of attention heads.
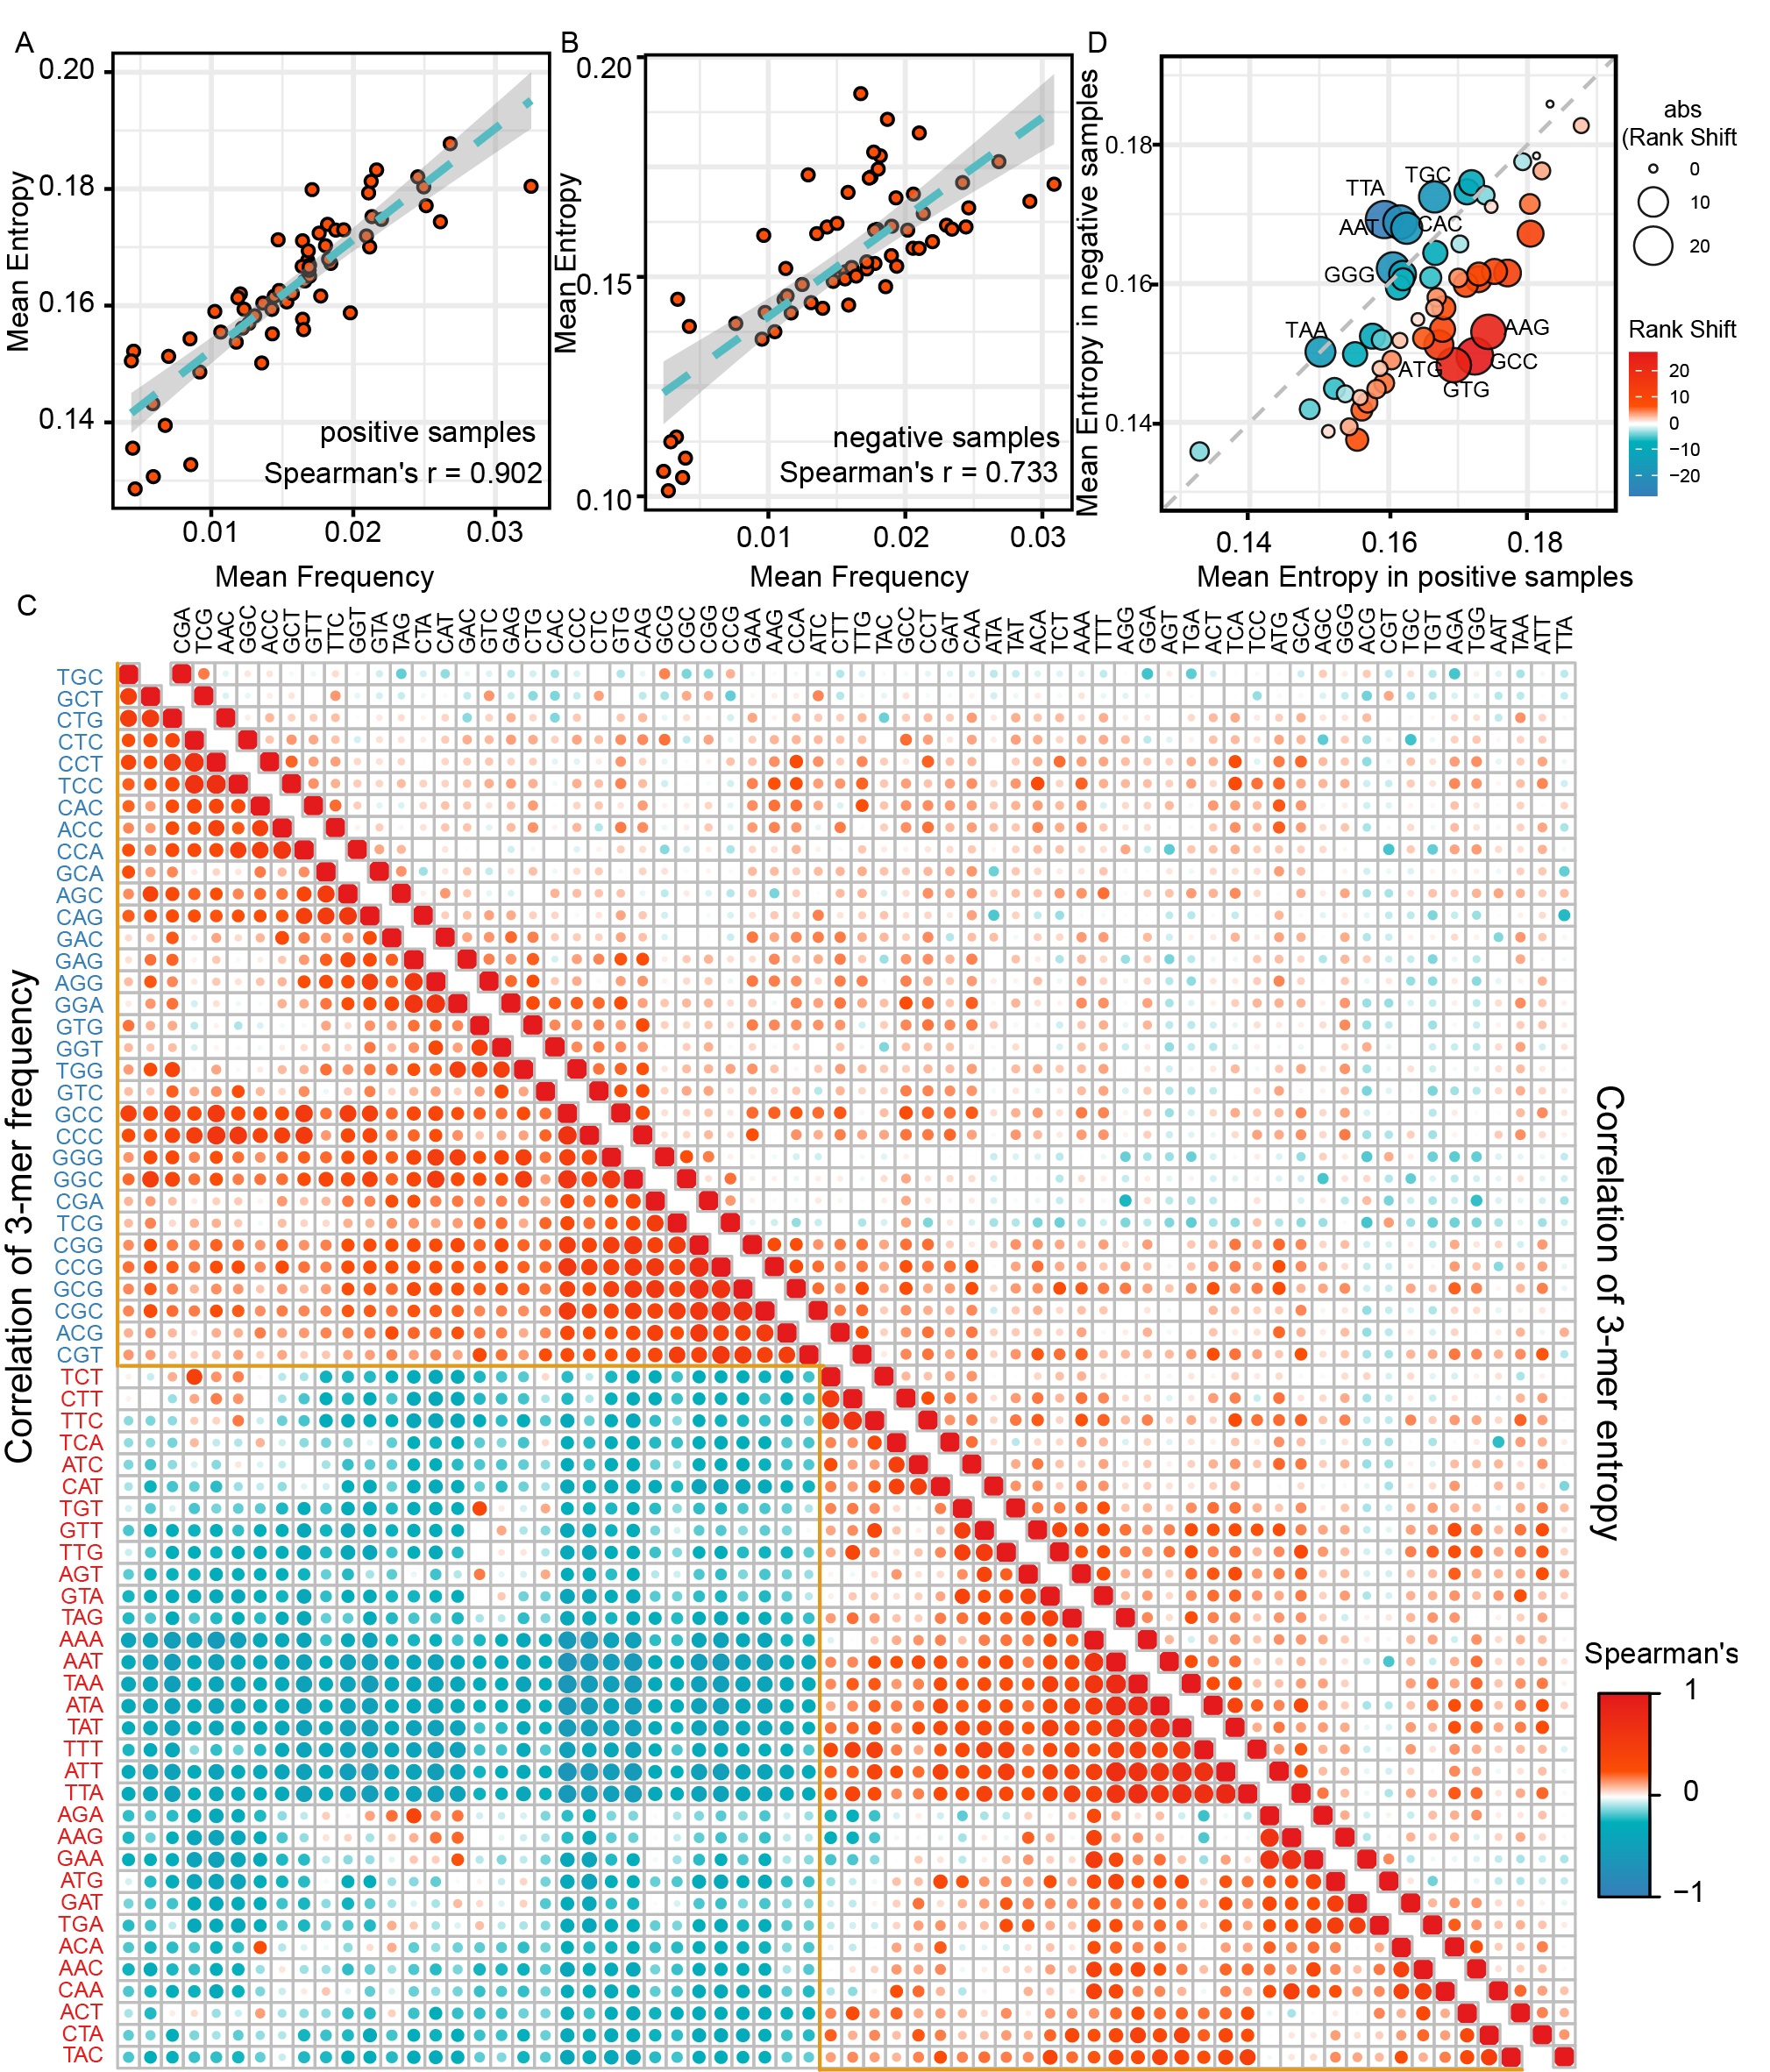
The interpretability analysis of 3-mers in cncFinder. (A–B) Correlation between 3-mer frequency and attention entropy in (A) positive and (B) negative samples. (C) Correlation heatmaps of 3-mer frequency (left) and entropy (right). (D) Rank difference analysis of 3-mer entropy between positive and negative samples.
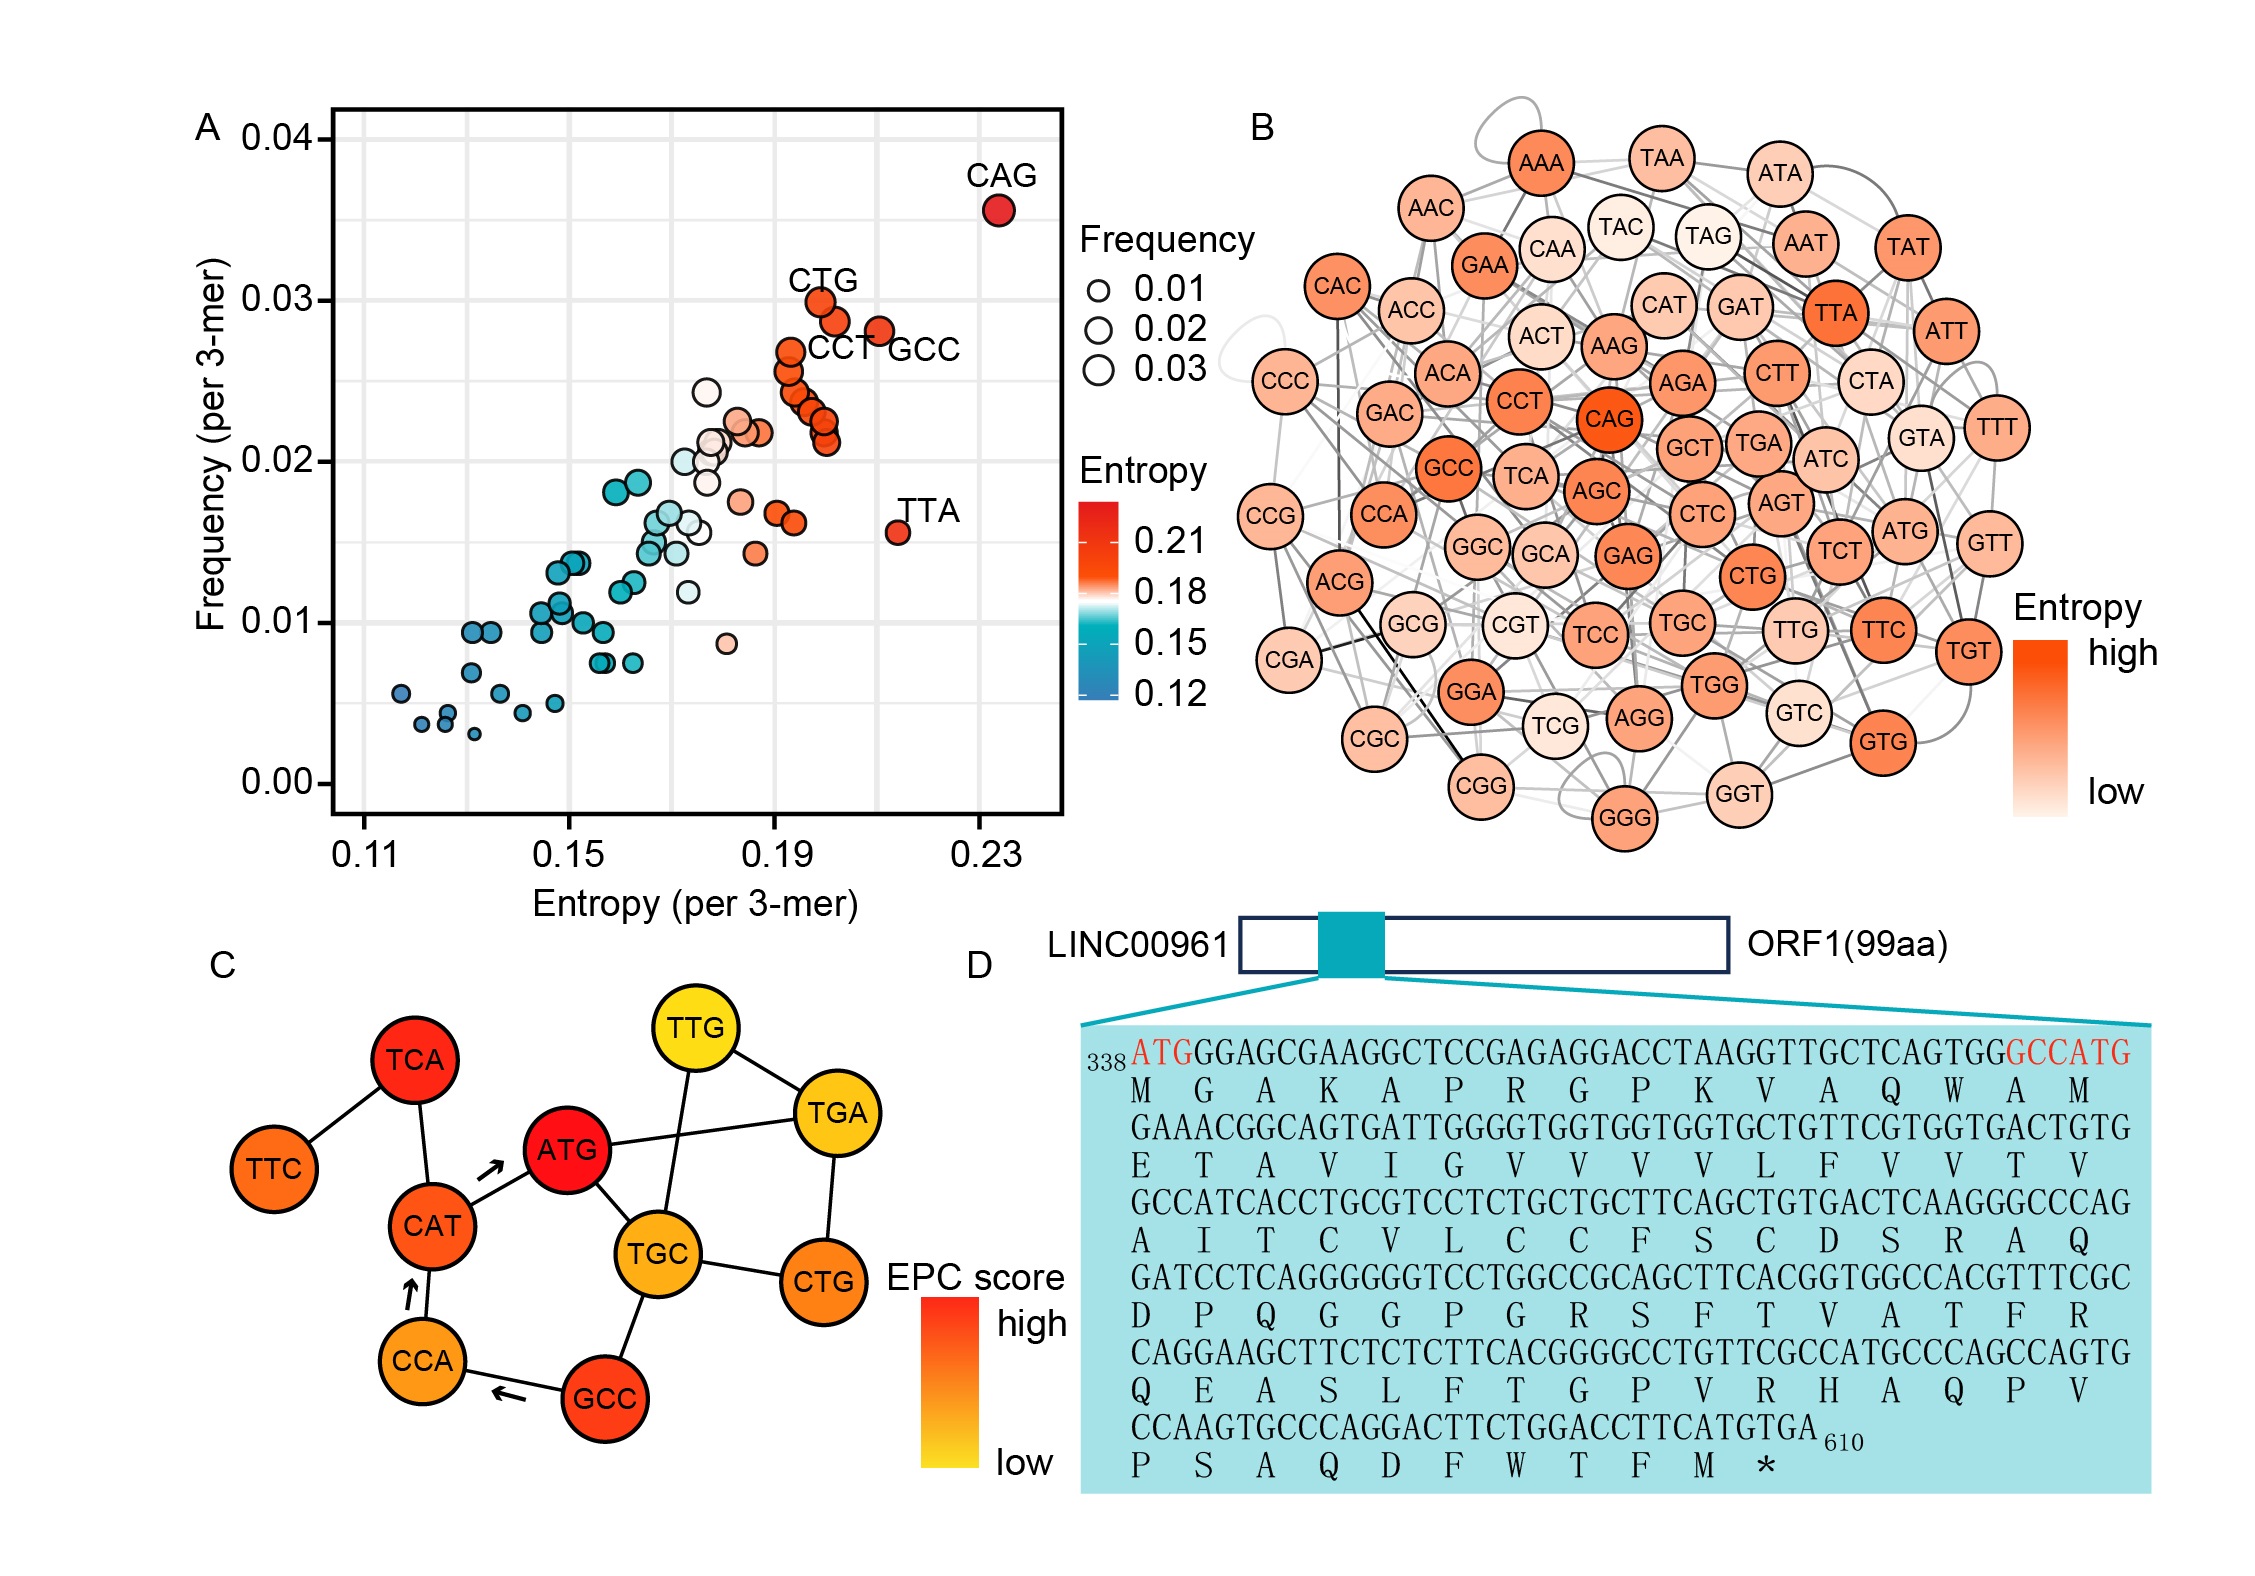
The interpretability analysis of the bifunctional lncRNA LINC00961. (A) Correlation between 3-mer entropy and frequency within LINC00961. (B) 3-mer interaction network constructed based on GAT-derived attention weights. (C) Top 10 ranked 3-mer with the highest network centrality by EPC analysis. (D) The experimentally validated ORF in LINC00961, containing two start codons capable of initiating translation.